
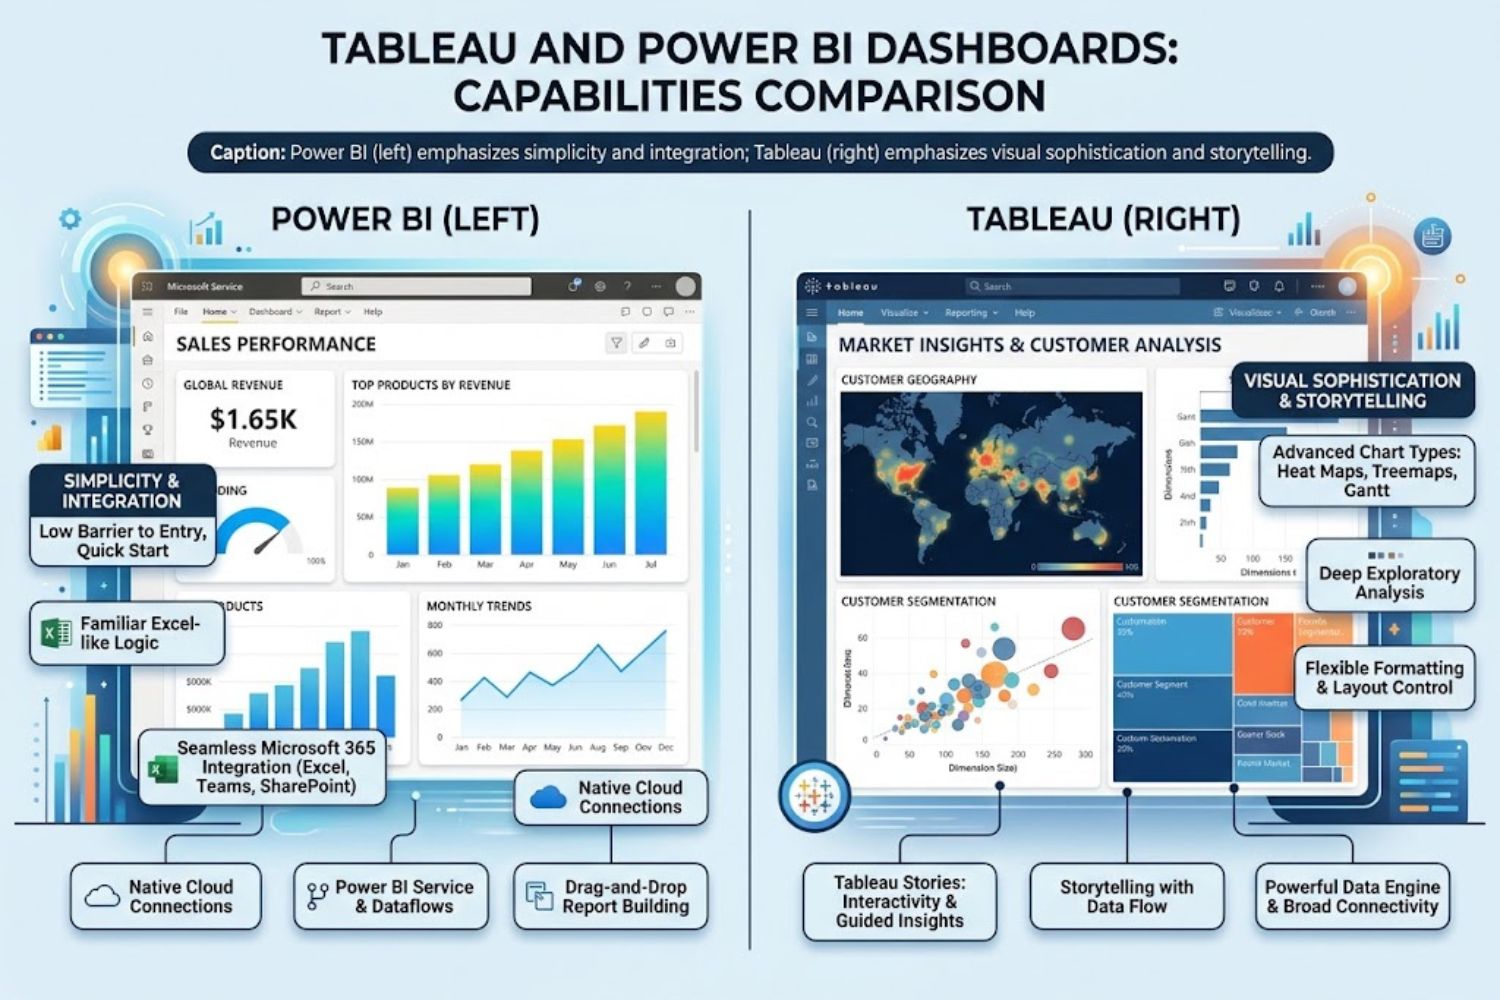
Tableau and Power BI dominate business intelligence for good reason. Both transform raw data into insights. But they solve different problems for different organizations. One prioritizes visual storytelling and analytical depth. The other prioritizes speed, cost, and Microsoft integration.
Choose the wrong tool, and you’ll waste months debugging governance issues, training frustrated analysts, or explaining why dashboards took six weeks to build. Choose right, and you’ll have a platform that scales with your team for years.
This guide cuts through marketing noise. It addresses gaps other comparisons miss—hidden costs, implementation realities, role-based guidance, and practical decision frameworks. By the end, you’ll know exactly which platform fits your situation.
Quick Comparison: The Essentials
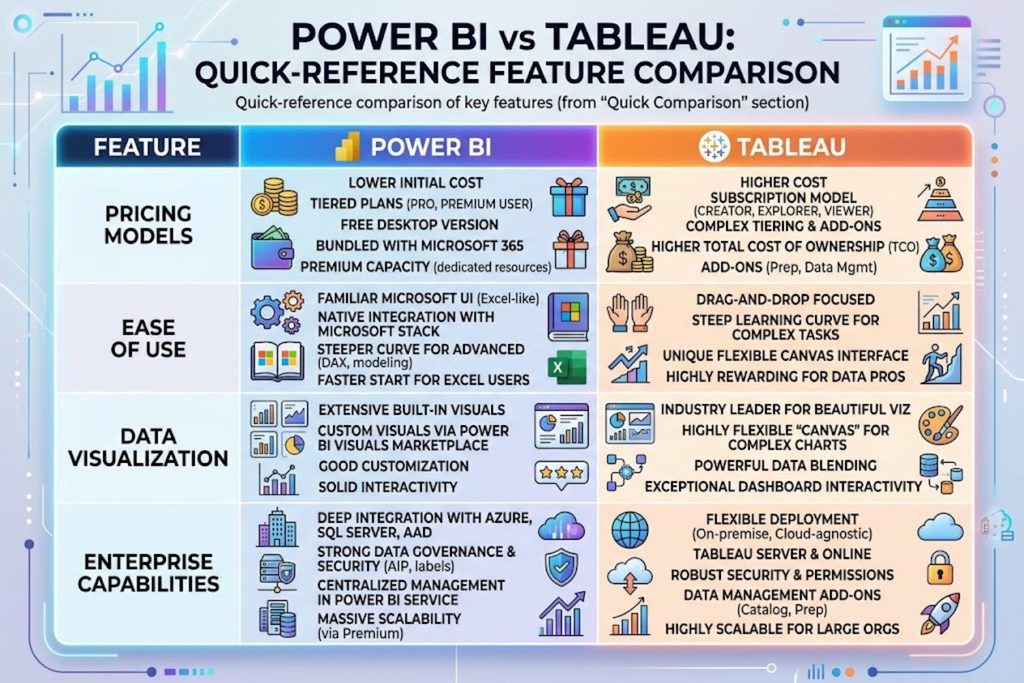
| Factor | Power BI | Tableau |
|---|---|---|
| Starting Price | $14/user/month (Pro) | $75/user/month (Creator) |
| Best For | Microsoft-centric teams, self-service analytics | Complex visualizations, exploratory analysis |
| Learning Curve | Moderate (Excel users have advantage) | Steeper (more powerful, more flexible) |
| Data Volume | Good for mid-size datasets | Excellent for large datasets |
| Visualization Quality | Solid, standard charts | Advanced, highly customizable |
| AI Features | Copilot (natural language queries) | Einstein (AI-powered insights) |
| Strength | Cost & integration | Flexibility & storytelling |
| Main Limitation | Less customization, scalability limits | Higher cost, steeper learning curve |
The Real Difference: Microsoft Ecosystem vs Visual Storytelling
These tools approach business intelligence from opposite angles.
Power BI is Microsoft’s answer to “How can we make analytics accessible to Excel users?” It’s designed for familiarity. If your team already knows Excel, pivot tables, and Microsoft 365, Power BI feels like a natural progression. It integrates seamlessly with everything Microsoft—SharePoint, Teams, Excel, Azure, Dynamics. It’s the path of least resistance for organizations already invested in Microsoft’s ecosystem.
Tableau is for teams that say, “We need more than standard charts.” It’s built for analysts who demand pixel-perfect control over every visualization, who need to explore data freely without rigid schemas, who want dashboards that tell a story, not just display numbers.
Think of it this way: Power BI is the default. Tableau is the choice.
Pricing & Total Cost of Ownership
Most comparisons stop at licensing. They won’t.
Upfront Licensing Costs
Power BI:
- Pro License: $14/user/month (minimum viable analytics)
- Premium Capacity: $5,000/month (required for enterprise deployment, >500 users, automated refresh, or embedded analytics)
- Total for 50 users: ~$8,400-13,400/year
Tableau:
- Creator License: $75/user/month (for dashboard creators)
- Explorer License: $35/user/month (for dashboard viewers who modify)
- Viewer License: $12/user/month (read-only access)
- Total for 50 creators: ~$45,000/year
Reality check: Tableau costs 3-4x more upfront. But that’s only 30% of the actual cost.
Hidden Costs Nobody Talks About
Training & Onboarding
Power BI’s learning curve is shorter, but Tableau users become more proficient faster. Here’s what organizations actually spend:
Power BI Training:
- Internal ramp-up: 40-80 hours per analyst
- External training: $2,000-5,000 per person
- Cost for 10 analysts: $20,000-50,000
Tableau Training:
- Internal ramp-up: 80-160 hours per analyst
- External certification: $3,000-6,000 per person
- Cost for 10 analysts: $30,000-60,000
Power BI gets people productive faster. Tableau requires deeper investment but produces more sophisticated work.
Infrastructure & Deployment
Power BI:
- Requires Premium Capacity for production (unless small pilot)
- Premium Capacity: $5,000/month minimum
- IT overhead: Low (Microsoft manages infrastructure)
- Deployment time: 2-4 weeks
Tableau:
- Can be deployed on-premises or cloud
- On-premises: Requires dedicated servers, backup systems, security hardening
- Cloud (Tableau Cloud): $80-120/month per user (plus Creator licenses)
- Deployment time: 4-8 weeks (more complex)
Practical cost: Power BI’s infrastructure is simpler but mandatory at scale. Tableau’s flexibility costs more in setup but offers more control.
Governance & Admin Overhead
Both platforms need governance. Neither makes it painless.
Power BI governance includes:
- Workspace management and access control
- Data lineage tracking
- Endorsement workflows
- Premium capacity management
- Refresh schedules and monitoring
- Estimated admin overhead: 5-10 hours/week for 50-100 users
Tableau governance includes:
- Project permissions and hierarchies
- Content ownership and certification
- Publish workflows and version control
- Performance monitoring and optimization
- Estimated admin overhead: 8-15 hours/week for 50-100 users
Tableau’s flexibility requires more governance. Power BI’s simplicity requires less, but less isn’t none.
Calculating Your Real TCO (3-Year Horizon)
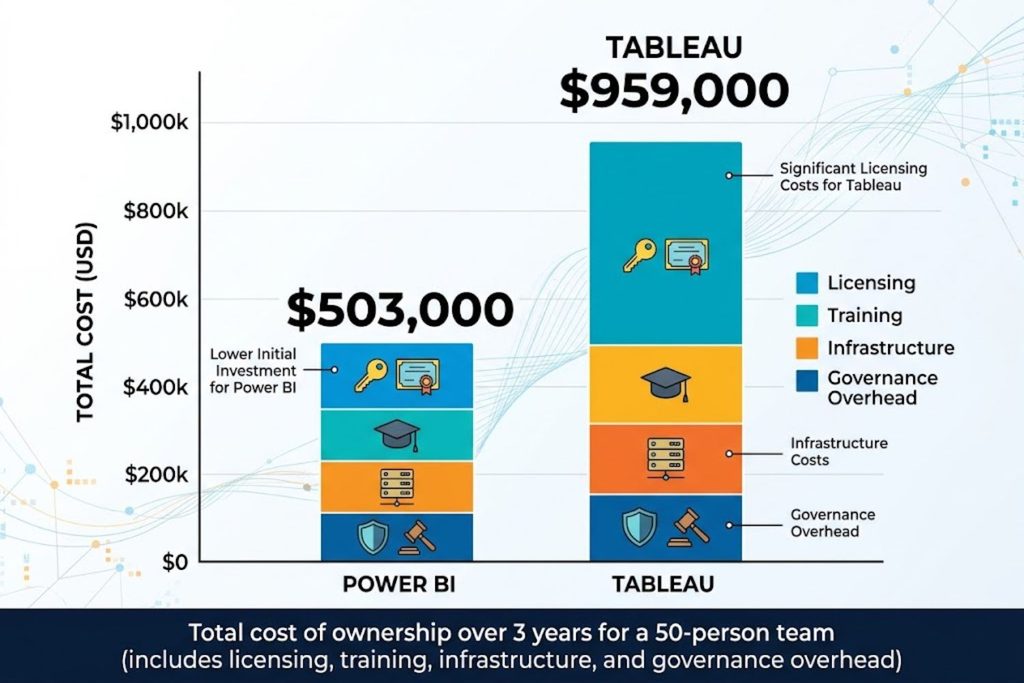
Scenario: 50 user team (30 creators, 20 viewers)
Power BI:
- Licensing: $168,000 (Pro) + $180,000 (Premium)
- Training: $35,000
- Infrastructure/IT: $20,000
- Admin overhead: $100,000 (2,600 hours)
- Total: ~$503,000
Tableau:
- Licensing: $540,000 (creators) + $144,000 (viewers)
- Training: $45,000
- Infrastructure/IT: $80,000
- Admin overhead: $150,000 (3,900 hours)
- Total: ~$959,000
But: Tableau creates more sophisticated, self-service analytics. Power BI requires more analyst involvement, which might mean hiring additional staff.
Core Features Compared
Data Connectivity & Integration
Power BI:
- 500+ native connectors (Excel, SQL Server, Azure, Salesforce, etc.)
- Strong with Microsoft stack (Azure Data Factory, SQL Server, Dynamics)
- Good with modern data warehouses (Snowflake, BigQuery, Redshift)
- Limitation: Some third-party connectors have refresh limitations
Tableau:
- 300+ native connectors (fewer than Power BI on paper)
- Superior flexibility: Connect to nearly any data source via custom APIs
- Better handling of complex, nested data structures
- Superior performance with very large datasets (billions of rows)
Winner for most teams: Power BI (simpler, more connectors). Winner for complex scenarios: Tableau.
Data Modeling & Transformation
Power BI:
- Power Query: Excel-like data transformation (no coding required)
- DAX: Powerful calculation language (formula-based)
- Automatic relationship detection (sometimes causes issues)
- Good for structured data, business metrics
Tableau:
- Tableau Prep: Visual data preparation (drag-and-drop)
- Limited built-in transformation (design philosophy: transform in source)
- Calculated fields: Powerful but less intuitive than DAX
- Better for exploratory analysis, ad-hoc calculations
Winner for data engineering: Power BI (more powerful transformations). Winner for analysts: Tableau (more flexible exploration).
Visualization Capabilities
Power BI:
- 20+ standard visualizations
- Custom visuals via marketplace (quality varies)
- Mobile optimization: Good but not perfect
- Limitation: Chart customization feels limited compared to Tableau
Tableau:
- 50+ built-in visualization types
- Advanced options: Watermarks, dynamic parameters, complex layering
- Mobile responsiveness: Excellent
- Custom shapes and annotations: Superior
Huge difference here: If visualization quality and flexibility matter, Tableau wins decisively. If standard charts suffice, Power BI is adequate.
AI & Machine Learning
Power BI:
- Copilot: Natural language queries (“Show me revenue by region”)
- Automated insights: Detects anomalies, trends
- R/Python integration: For advanced users
- Newer feature, still maturing
Tableau:
- Einstein Analytics: AI-powered insights (from Salesforce)
- Demand forecasting, clustering, prediction
- More mature AI implementation
- Better for predictive analytics
Winner: Tableau for serious AI/ML work. Power BI’s Copilot is useful but simpler.
Collaboration & Sharing
Power BI:
- Seamless Teams integration
- Easy sharing via workspace
- Comments and annotations
- Real-time data refresh notifications
Tableau:
- Salesforce integration for CRM workflows
- Scheduled alerts and subscriptions
- Strong for publishing polished dashboards
- Tableau Pulse: AI-driven personalized insights
Winner: Power BI for internal collaboration (Teams-native). Tableau for customer-facing analytics.
Mobile Access
Power BI:
- Mobile app: Good performance, responsive
- Limitation: Some features unavailable on mobile
Tableau:
- Mobile app: Excellent responsiveness
- Maintains full interactivity on phones
- Better for field teams, salespeople
Winner: Tableau for mobile-first teams.
Performance at Scale
Power BI:
- Good performance up to 1GB datasets
- Struggles with very large datasets (>10GB)
- DirectQuery mode helps but adds complexity
Tableau:
- Excellent with large datasets (100GB+)
- In-memory caching handles billions of rows
- Performance doesn’t degrade as sharply
Winner for large-scale analytics: Tableau.
Which Tool for Which Role?
Your role shapes which tool feels better.
For Business Analysts
Best Choice: Power BI
You likely know Excel deeply. Power BI’s DAX mirrors Excel formulas. You can build dashboards in hours instead of days. The Microsoft ecosystem integration means less IT friction.
Caveat: If your work requires pixel-perfect visualizations or complex exploratory analysis, consider Tableau.
For Data Engineers
Best Choice: Tableau (with a twist)
Tableau’s flexibility for handling diverse data sources and complex transformations appeals to engineering mindsets. You’ll appreciate the ability to connect to nearly anything.
Reality: Many data engineers use both. They build data pipelines in Python/SQL, expose them via APIs, and connect both tools as needed.
For Executive Decision-Makers
Best Choice: Power BI
Executives want dashboards that work on their schedule. Power BI’s simplicity, cost, and integration with email/Teams workflows means reports reach executives effortlessly. You don’t need to understand tools—you need insights delivered fast.
For Self-Service Analytics Users
Best Choice: It Depends
Power BI if: Your organization uses Microsoft 365 extensively. Your questions are straightforward (revenue by region, sales pipeline status, customer trends).
Tableau if: Your questions are complex, exploratory, or require advanced visualizations. Your team values design and storytelling in analytics.
Implementation Timeline & Complexity
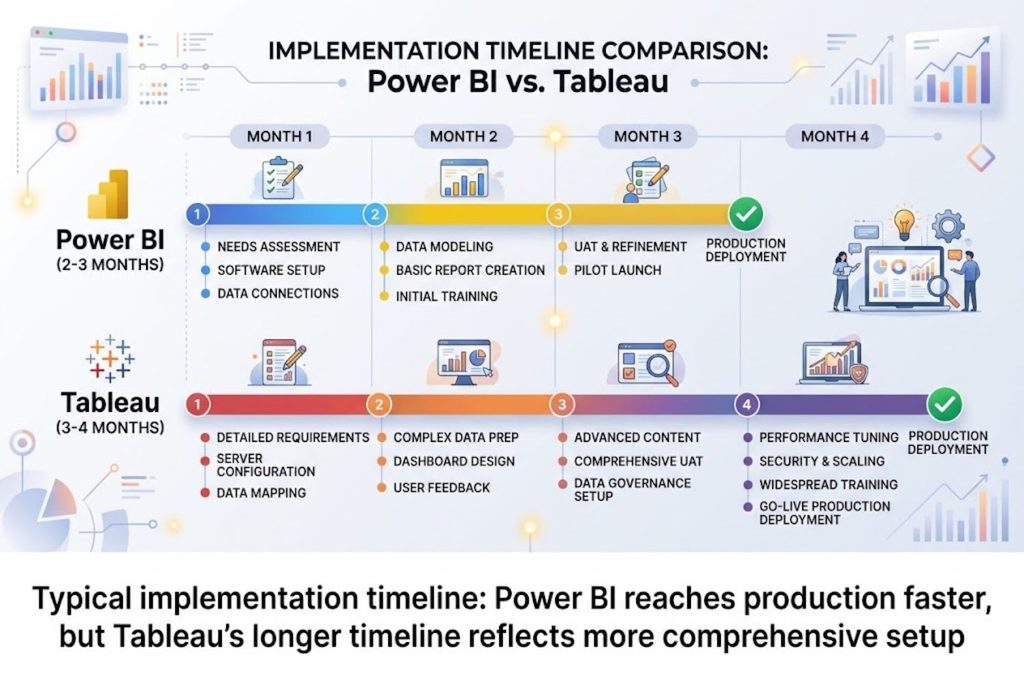
The timeline matters more than the tool’s capabilities.
Time to First Dashboard
Power BI: 1-2 weeks
- Day 1-2: Setup, user provisioning
- Day 3-5: Training on Power Query and basic dashboarding
- Day 6-10: First dashboard creation
- Day 10-14: Testing, refinement, publication
Tableau: 2-3 weeks
- Day 1-3: Setup, training on data sources and Tableau’s design philosophy
- Day 4-7: Deep training on visualization best practices
- Day 8-15: First dashboard creation
- Day 15-21: Iterative refinement (Tableau dashboards take longer to get right)
Implication: Power BI shows value faster. Tableau requires patience but delivers more sophistication.
Time to Production-Grade Solution
Power BI: 2-3 months
- Governance setup
- Refresh schedules and monitoring
- Performance optimization
- User adoption and change management
Tableau: 3-4 months
- More complex governance (projects, permissions, hierarchies)
- Performance tuning for large datasets
- Change management (steeper learning curve = more training)
- Certification and publishing workflows
Organizational Change Management
Both tools require organizational buy-in.
Power BI change management:
- Leverage existing Excel skills
- Position as “better Excel”
- IT teams typically embrace it (Microsoft ecosystem)
- Risk: Users see it as yet another Microsoft tool, adoption stalls
Tableau change management:
- Requires mindset shift: “analytics is a service, not an IT request”
- Powerful for building data-driven culture
- Risk: Steep learning curve causes frustration
- Mitigation: Strong training and executive sponsorship essential
When Power BI Wins (And When It Doesn’t)
Power BI Wins When:
✓ Your organization is Microsoft-heavy (Office 365, Azure, Dynamics, Excel) ✓ Budget is tight and TCO matters ✓ You need quick deployment ✓ Your team needs self-service analytics (not complex exploration) ✓ Users need seamless Teams/SharePoint integration ✓ Your data is structured and moderate-volume ✓ You prioritize ease of learning over visualization sophistication
Power BI Struggles When:
✗ You need pixel-perfect, highly customized visualizations ✗ Your data is very large (100GB+) or highly unstructured ✗ You need advanced predictive analytics ✗ Your team values data exploration and discovery over standard reports ✗ Mobile-first analytics is critical ✗ You need public-facing customer analytics (requires extra infrastructure) ✗ Your governance needs are extremely complex
When Tableau Wins (And When It Doesn’t)
Tableau Wins When:
✓ Data visualization quality directly impacts decisions ✓ You need exploratory analytics and discovery ✓ Your data is large, complex, or from diverse sources ✓ Mobile analytics and field team access is critical ✓ Advanced AI/predictive analytics matters ✓ Your team values storytelling and insight sharing ✓ You need sophisticated customer-facing analytics ✓ Long-term ROI justifies higher upfront costs
Tableau Struggles When:
✗ Budget is severely constrained ✗ You need rapid deployment (your timeline is weeks, not months) ✗ Your team lacks analytics sophistication ✗ You’re Microsoft-only (forces extra integration work) ✗ You need tightly controlled, governance-first environments ✗ Data sources are simple and well-structured ✗ Users just need straightforward operational dashboards
The Decision Framework: How to Choose
Don’t pick based on marketing claims. Use this framework.
Step 1: Assess Your Tech Stack
Ask yourself:
- How much of our software is Microsoft (Office, Azure, Dynamics)?
- Do we use Salesforce extensively?
- What’s our data warehouse (Snowflake, BigQuery, Redshift, SQL Server)?
Scoring:
- Heavily Microsoft ecosystem? Power BI gains 2 points.
- Salesforce ecosystem? Tableau gains 1 point.
- Neutral tech stack? No advantage yet.
Step 2: Define Your Primary Use Case
Is your need:
- Operational dashboards (sales pipeline, support tickets)? Power BI gains 1 point.
- Exploratory analysis (market research, customer behavior)? Tableau gains 2 points.
- Executive reporting (KPIs, board dashboards)? Either works, no points.
- Customer-facing analytics? Tableau gains 1 point.
Step 3: Calculate True Cost of Ownership
Use the formula above. Include training, infrastructure, and admin overhead. If TCO is critical and tight, Power BI gains 2 points. If quality justifies cost, no advantage yet.
Step 4: Evaluate Team Skill Level
Your team’s analytics maturity:
- Mostly Excel users, non-technical? Power BI gains 2 points.
- Mix of technical and non-technical? Neutral.
- Data engineers and analysts? Tableau gains 1 point.
Step 5: Run a Proof of Concept
Take your 3-5 most complex business questions. Give each team 2 weeks to build dashboards with their tool. Evaluate:
- How quickly did teams get productive?
- How polished were the final dashboards?
- How easy was it to modify and iterate?
- How well did it integrate with existing workflows?
This matters more than any feature list.
Decision rule: If final scores are within 2 points, run a proof of concept. If one tool scores 5+ points higher, you have your answer.
Real-World Implementation Considerations
Features matter less than execution.
Migration from Legacy Systems
If migrating from existing BI tool:
Power BI path:
- Parallel run (old + new system) for 2-3 months
- Migrate dashboards incrementally
- Your Excel-based reports transition naturally
- Estimated effort: 3-4 months, moderate complexity
Tableau path:
- Requires rethinking how dashboards are built (different architecture)
- Can’t simply copy old designs
- Build new, better dashboards from scratch
- Estimated effort: 4-6 months, higher complexity
Implication: Power BI is easier to migrate to. Tableau is worth the migration effort if you redesign your analytics from the ground up.
Managing Governance at Scale
Power BI governance essentials:
- Establish workspace naming conventions
- Create endorsement workflows (app, endorsed, certified)
- Document refresh schedules and dependencies
- Monitor Premium capacity usage
- Regular audits of access control
Tableau governance essentials:
- Design project hierarchy (business unit, team, analytics type)
- Create certification workflows for trusted content
- Implement data governance partnerships with IT
- Monitor and optimize workbook performance
- Regular owner reviews (who owns what, is it still used?)
Practical truth: Governance isn’t a one-time setup. Plan for ongoing investment.
Training Your Team
Power BI training roadmap (8 weeks):
- Week 1-2: Excel users → Power Query (transformations)
- Week 2-3: Building your first dashboard
- Week 3-4: DAX fundamentals
- Week 5-6: Data modeling and relationships
- Week 7-8: Advanced topics (performance tuning, AI features)
Tableau training roadmap (12 weeks):
- Week 1-2: Data sources and connections
- Week 2-4: Visualization best practices and design
- Week 4-6: Dashboard interactivity and parameters
- Week 6-8: Performance optimization
- Week 8-10: Advanced analytics and Prep
- Week 10-12: Storytelling and complex scenarios
Invest in training. It’s non-negotiable.
Future-Proofing Your Choice
Thinking beyond today:
Power BI trajectory:
- Microsoft is investing heavily in AI (Copilot integrations expanding)
- Tight integration with Fabric and modern data stack
- Strategy: Power BI is becoming Microsoft’s unified analytics platform
- Future-proofing: Choose Power BI if you plan to deepen Microsoft ecosystem
- Risk: Relies on Microsoft’s continued analytics investment
Tableau trajectory:
- Salesforce is positioning Tableau as advanced analytics (not operational BI)
- Strategy: Specialized tool for analysts and data teams, not self-service
- Future-proofing: Choose Tableau if you plan to hire dedicated analytics talent
- Risk: Salesforce might deprioritize Tableau for CRM integration push
Practical reality: Both will be viable for 5+ years. Your choice should handle your next 3-5 years, not predict the next 10.
Frequently Asked Questions
Q: Can we use both Tableau and Power BI?
A: Yes, many enterprises do. Typical pattern: Power BI for operational dashboards (sales, support), Tableau for exploratory analysis (research, strategy). Downside: Training costs double, governance gets complex. Only pursue if both use cases are strong.
Q: Which has a shorter learning curve?
A: Power BI, especially if you know Excel. Tableau requires deeper analytical thinking but produces more sophisticated work. Speed vs. sophistication tradeoff.
Q: What if we outgrow the tool we choose?
A: Switching tools is expensive. Better to choose slightly more powerful tool now than migrate later. If uncertain, lean Tableau. If budget-constrained, lean Power BI.
Q: Is Tableau better for visualization?
A: Decisively yes. If visualization quality drives decisions, Tableau is worth the cost premium.
Q: Does Power BI require a Premium license?
A: For small pilots (under 50 users), no. For production enterprise analytics, yes. Premium is effectively mandatory cost.
Q: What about cost increases over time?
A: Power BI scaling: Linear (add users, add cost). Tableau scaling: Moderate at first, accelerates with more data. Plan for 15-25% annual cost increases for both.
Q: Which is more secure?
A: Both meet enterprise security requirements (SSO, encryption, audit logs). Power BI has slight advantage (Microsoft infrastructure, compliance parity with Office 365). Tableau provides more granular permission control.
Q: What if we’re not sure we need BI at all?
A: Start with Power BI. Lower cost, faster ROI proof. If you outgrow it, migrate to Tableau. If it’s sufficient, you’ve saved money.