Here’s the straightforward definition: Droven IO AI automation tools are a category of intelligent workflow platforms, RPA systems, and LLM-powered agents that combine tool-use loops, agent memory, and retrieval-augmented generation to automate business processes without hallucinating. These platforms connect disparate systems, analyze incoming data, and execute workflows automatically—freeing humans from repetitive work.
But here’s what most articles get wrong: Droven.io itself isn’t a software product. It’s a vendor-neutral knowledge platform that researches and documents automation tools. It explains the landscape before you spend a dollar on it. Think of it as a trusted technology analyst, not a product marketplace.
The confusion matters because too many organizations spend time evaluating Droven.io as a tool when they should be using it as a research layer to understand which actual tools fit their needs.
Core Architecture: Agents + APIs + Workflow Orchestration
Modern automation tools work by connecting three components:
1. Intelligent Agents — AI models that can reason, make decisions, and execute tasks without following rigid rule sets. Unlike traditional automation that follows if-then logic, intelligent agents analyze context and adapt.
2. API Connections & Data Pipelines — Webhooks, REST APIs, and middleware that connect your existing systems (CRM, ERP, accounting software, communication platforms) into a unified data flow.
3. Workflow Orchestration — The sequencing layer that determines when tasks execute, handles errors, manages dependencies, and ensures data flows correctly between systems.
When these three work together, you get something powerful: a system that can handle a customer support ticket by analyzing sentiment, categorizing urgency, drafting a response, and updating your CRM—all without human intervention.
Key Distinction: Vendor-Neutral Knowledge Platform vs. Execution Tool
Understanding this distinction saves months of confusion:
Droven.io (Knowledge Layer) — Explains what tools do, who they serve, where they fail, comparison frameworks, implementation guidance. You read Droven.io to build clarity before choosing tools.
Execution Tools — n8n, Make, Zapier, Blue Prism, UiPath, and custom LLM systems actually run the automations. You implement these tools to build and deploy workflows.
Most organizations should use Droven.io to research, then hire specialists or use your technical team to deploy the actual automation. Trying to use Droven.io as an execution platform is like trying to use an architecture textbook to build a house.
Three Tool Categories That Dominate the Landscape
Workflow Automation Platforms (n8n, Make, Zapier AI) — Visual workflow builders that connect apps without code. Best for: non-technical teams, quick ROI, 50-500 process automation.
Robotic Process Automation (RPA) (Blue Prism, UiPath) — Mimics human interaction with systems. Best for: legacy system automation, complex screen scraping, highly regulated industries.
Custom LLM Agents & No-Code Builders (LangChain, n8n with AI models, Make with AI) — AI-native systems that use large language models for reasoning. Best for: decision-making tasks, unstructured data processing, dynamic workflows.
Each category has different cost structures, implementation timelines, and ROI profiles. Most organizations will use multiple categories.
The Honest Truth About Automation ROI (What Competitors Skip)
Every article says automation “reduces costs by 30-60%.” But that number comes with conditions that nobody explains.
Here’s what actually happens in most automation projects:
Why 71% of AI Automation Projects Fail (It’s Rarely the Technology)
According to Kore.ai research, 71% of AI tools get abandoned within six months. That’s not because the technology failed. It’s because:
- People didn’t adopt it — Teams reverted to old processes because they didn’t understand the change
- No one measured it — Savings weren’t tracked, so ROI remained invisible
- Workflow wasn’t redesigned — Automation was bolted onto broken processes instead of fixing them first
- Escalation paths didn’t exist — The system had no way to hand off to humans when needed
- Baseline metrics were missing — Organizations couldn’t prove what they saved because they never measured before deployment
The technology wasn’t the problem. The implementation was.
The Five Types of ROI Your Leadership Needs to Understand
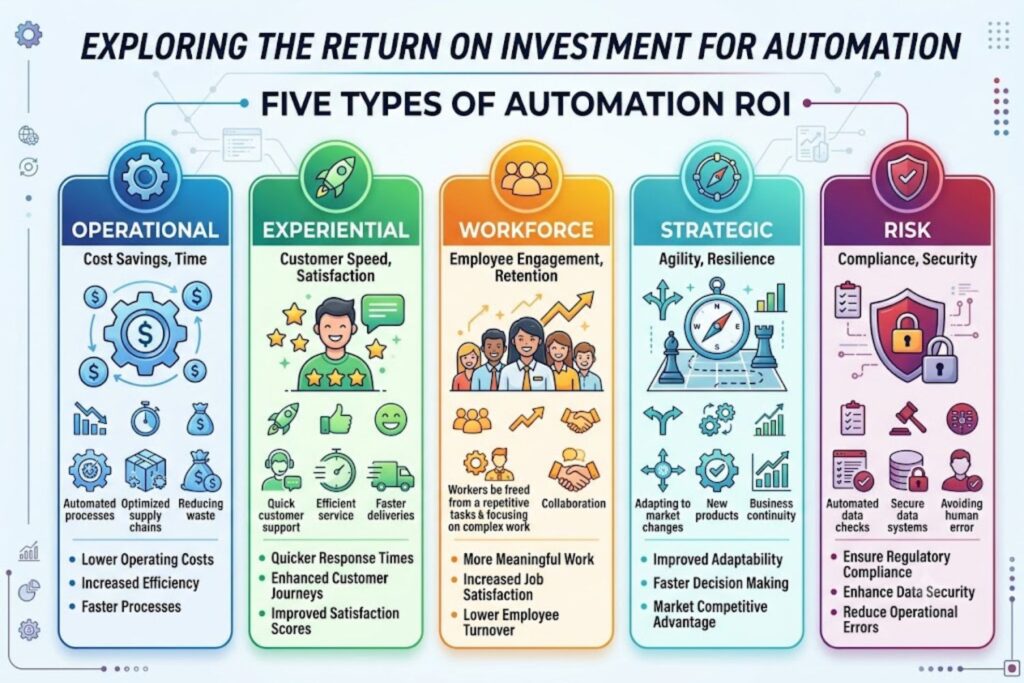
Most organizations measure only one type of ROI. That’s why they miss the bigger picture.
Operational ROI — Direct cost and time savings
- Hours saved per week
- Cost per transaction before vs. after
- Reduction in manual errors
- Processing time reduction
- Example: Automating invoice processing saves 3 hours per week = ~$12,000 annually
Experiential ROI — Speed and quality of experience
- Customer response time reduction (2 days → 2 hours)
- Reduced context switching for employees
- Faster decision-making
- Fewer escalations
- Example: Instant lead qualification improves sales conversion by 8%
Strategic ROI — Competitive advantage and resilience
- Ability to scale without hiring
- Improved agility in market changes
- Better talent retention (people focus on meaningful work)
- Reduced risk through consistent processes
- Example: Automating compliance workflows reduces audit risk by 40%
Experiential ROI — Employee satisfaction and productivity
- Employees focus on high-value work
- Skill development opportunities
- Job satisfaction improvements
- Attrition reduction
- Example: Moving support staff from ticket handling to customer success roles
Strategic ROI — Long-term business resilience
- Business continuity capabilities
- Scalability without proportional cost increases
- Risk mitigation through standardization
- Example: Automated disaster recovery processes reduce downtime risk
Most organizations focus only on operational ROI and miss 80% of the value. McKinsey research shows that high-performing organizations redesign workflows around automation capabilities, capturing 3x more value than those that simply overlay automation on existing processes.
The Hidden Cost: Productivity Leakage
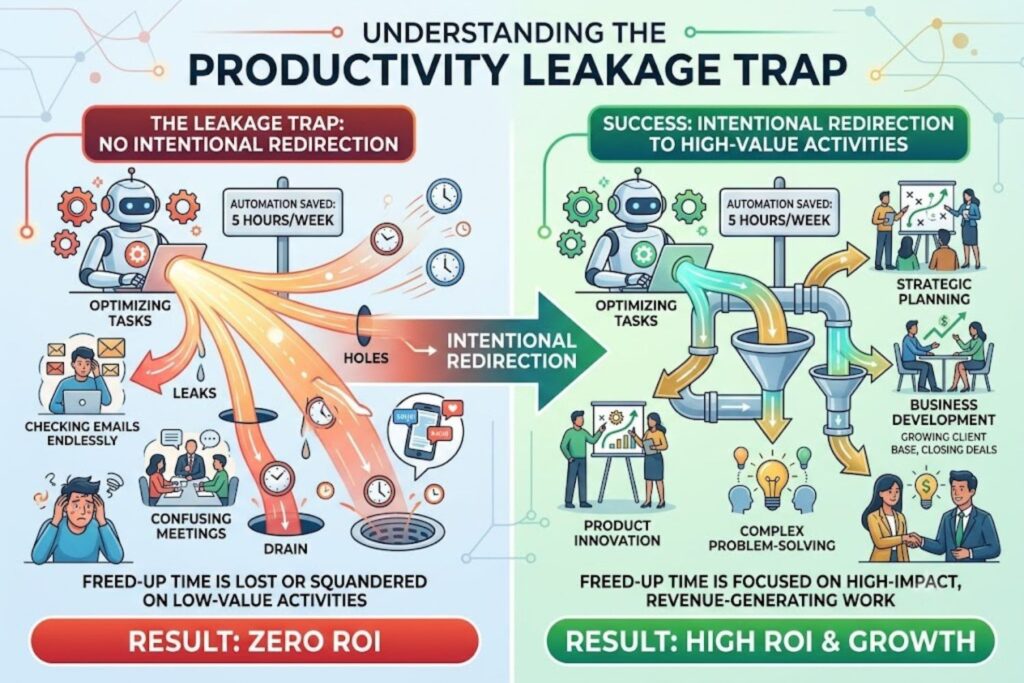
Here’s the challenge nobody mentions: replacing manual work doesn’t automatically create value. The time saved has to be redirected toward something profitable.
If you automate a process that saves 5 hours per week, but the employee who performed it now sits idle, you haven’t achieved ROI. You’ve just rearranged the cost structure.
The best automation implementations include a plan for how freed-up time creates new value:
- Customer-facing work instead of back-office processing
- Strategic initiatives instead of routine tasks
- New revenue-generating activities instead of repetitive work
- Skill development instead of doing the same thing faster
Without this redirection, you get “productivity leakage”—saved time that never converts to business value.
Baseline Measurements: Why 73% of Organizations Get This Wrong
Here’s the single biggest mistake in automation projects:
Organizations deploy automation tools without measuring what the baseline was before deployment.
Then they launch the automation, see some improvement, and have no way to prove how much it actually saved because they never captured the “before” state.
Deloitte research found that 73% of organizations struggle to define their digital initiatives’ exact impact or metrics. The root cause? They skipped baseline measurement.
Before deploying any automation:
Measure these metrics for 2-4 weeks:
- Average processing time per transaction
- Manual effort hours per week
- Error rate and rework costs
- Customer response times
- Employee satisfaction scores
- System uptime and reliability
- Compliance violations or audit findings
Then deploy automation, and measure the same metrics again after 4-12 weeks.
The comparison is your ROI proof. Without it, you’re guessing.
When (And When NOT) to Use AI Automation Tools
Not every process should be automated. Some processes are better handled manually, and automating them creates problems.
Your Organization Is Ready If… (Decision Matrix)
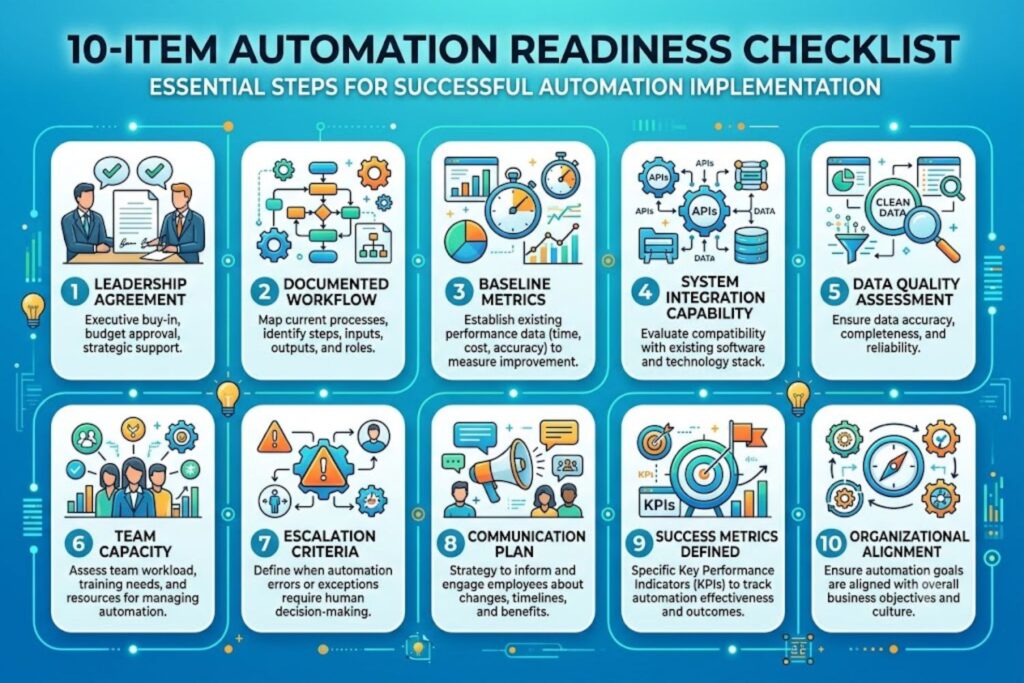
✓ You have documented processes (or can create them) ✓ You’ve measured current performance metrics ✓ You have executive sponsorship and budget ✓ Your data is reasonably clean and structured ✓ You have integration capabilities (API access to your systems) ✓ You can dedicate a team member (10-20 hours/week) to manage automation ✓ Your processes are stable (not changing every month) ✓ You can define escalation paths for exceptions ✓ You’re willing to redesign workflows around automation ✓ You have change management resources for adoption
Score: 8+ yes answers = You’re ready. 5-7 = You need preparation. <5 = Build foundation first.
Your Organization Is NOT Ready If… (Red Flags)
✗ Your processes are undefined or inconsistently followed ✗ You have poor data quality (garbage in, garbage out) ✗ You lack executive alignment on goals ✗ Your team is already at 100% capacity ✗ Your systems don’t have API access or integration capabilities ✗ Your processes change constantly ✗ You’re trying to automate “everything at once” ✗ You lack change management or training resources ✗ You want automation to fix broken processes ✗ You have no way to measure success before starting
Red flag count: 4+ = Pause. Fix these first before automation.
Workflow Assessment Framework
Not all processes deliver equal ROI. Some workflows are automation “home runs.” Others are time wasters.
High-Priority Automation Triggers:
- High volume, low complexity (repetitive work at scale)
- High error rate (manual process prone to mistakes)
- Time-sensitive (speed creates business value)
- Highly manual (majority is typing, data entry, context switching)
- Predictable patterns (consistent triggers, predictable paths)
- Integration-heavy (requires connecting multiple systems)
- 24/7 requirement (humans can’t provide 24/7 coverage)
Processes That Fail With Automation:
- Highly judgmental (requires nuanced human decision-making)
- Rare or inconsistent (low volume makes automation costs exceed benefits)
- Creative work (ideation, design, strategy)
- Requires deep context (rare exceptions, edge cases)
- Involves legal liability (automation makes error unacceptable)
- Requires relationship-building (customer trust depends on human connection)
The 80/20 Rule: Where to Start
Start with 20% of your workflows that drive 80% of the value.
Calculate value by multiplying: Volume × Time per transaction × Hourly rate × Annual frequency
A process handled 50 times per week, taking 15 minutes per transaction, by someone earning $25/hour = $1,950 annual value if fully automated.
A process handled 3 times per month, taking 1 hour per transaction = $900 annual value if fully automated.
The first process is 2x more valuable to automate.
Most organizations start with the wrong processes. They pick processes they personally hate, not processes with highest ROI.
The Realistic Implementation Roadmap (No Buzzword Version)
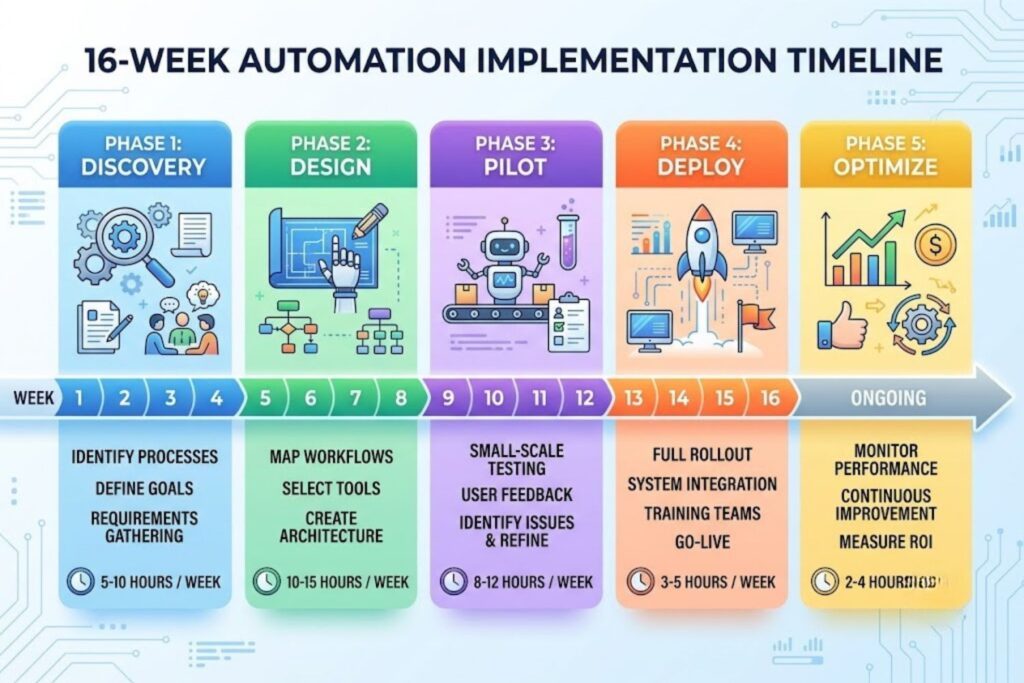
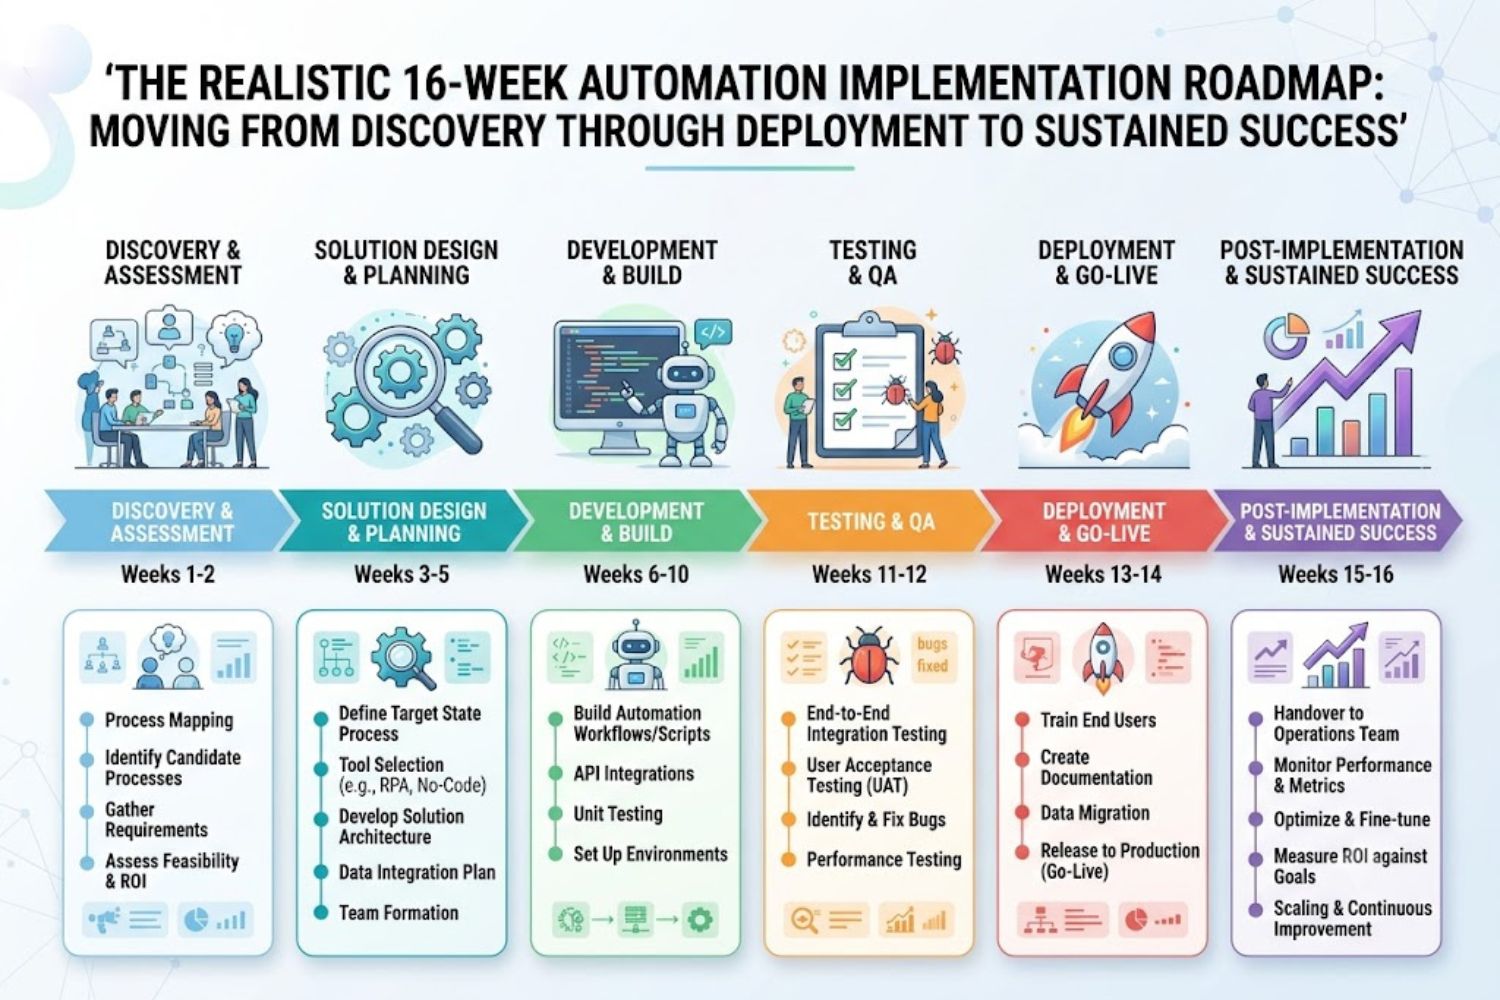
Most articles gloss over timeline with “start small.” Here’s what actually happens:
Phase 1: Discovery & Baseline (Weeks 1-4)
What you do:
- Map the current workflow (step-by-step, decision points, exceptions)
- Identify integration points (what systems need to connect)
- Measure baseline metrics (processing time, error rate, hours spent)
- Document success criteria (what does “success” actually mean?)
- Assess data quality (is your data clean enough to automate?)
- Identify stakeholders (who owns this process, who’s affected)
Time investment: 5-10 hours/week from 1-2 team members
Common mistake: Skipping the mapping step and jumping straight to tool selection
Phase 2: Workflow Design & Redesign (Weeks 5-8)
What you do:
- Design the ideal automated workflow (not the current workflow, but the better workflow)
- Identify decision trees and exceptions (when does a human need to step in?)
- Build integration specifications (what data moves where)
- Plan for error handling (what happens when automation fails?)
- Design escalation paths (how do edge cases get to humans?)
- Create training and communication plan (how will people learn this?)
Time investment: 10-15 hours/week from 2-3 team members
Critical insight: Most implementation failures happen because teams automate their broken processes instead of redesigning them first. McKinsey found that high performers redesign workflows before or alongside automation—and they capture 3x more ROI than those who skip this step.
Phase 3: Pilot Automation & Testing (Weeks 9-12)
What you do:
- Build the automation in a sandbox environment
- Test with synthetic data first (not real customer data)
- Run parallel processes (automation + human, compare outputs)
- Test failure scenarios (what happens when the integration fails?)
- Measure pilot results against baseline
- Identify training gaps and workflow adjustments
Time investment: 8-12 hours/week from 1-2 technical team members
Key metric: Success rate should exceed 95% before moving to production (not 90%, not 85%, 95%+)
Phase 4: Full Production Deployment (Weeks 13-16)
What you do:
- Deploy automation to production
- Activate human escalation paths
- Go live with trained team
- Monitor closely for first 2 weeks
- Capture real production metrics
- Address issues as they arise
Time investment: 3-5 hours/week from operations team for monitoring
Critical detail: Most failures happen in the first 3 weeks post-launch. Intensive monitoring during this period prevents most problems from becoming systemic.
Phase 5: Monitoring, Optimization & Scaling (Ongoing)
What you do:
- Track automation success rate (should stay 95%+)
- Monitor ROI metrics against baseline
- Identify optimization opportunities
- Gather feedback from users
- Plan expansion to additional workflows
- Update documentation as processes evolve
Time investment: 2-4 hours/week ongoing
What most teams miss: The best ROI comes from optimizing and scaling successful automation, not from launching new automation. Spend 80% of your effort on the 20% of automations that drive 80% of value.
The Hidden Challenges Nobody Warns You About
Every automation project hits these obstacles. They’re predictable. They’re solvable. But they’re rarely discussed until teams are already struggling.
Data Quality Issues (Poor Data Reduces ROI by 40-60%)
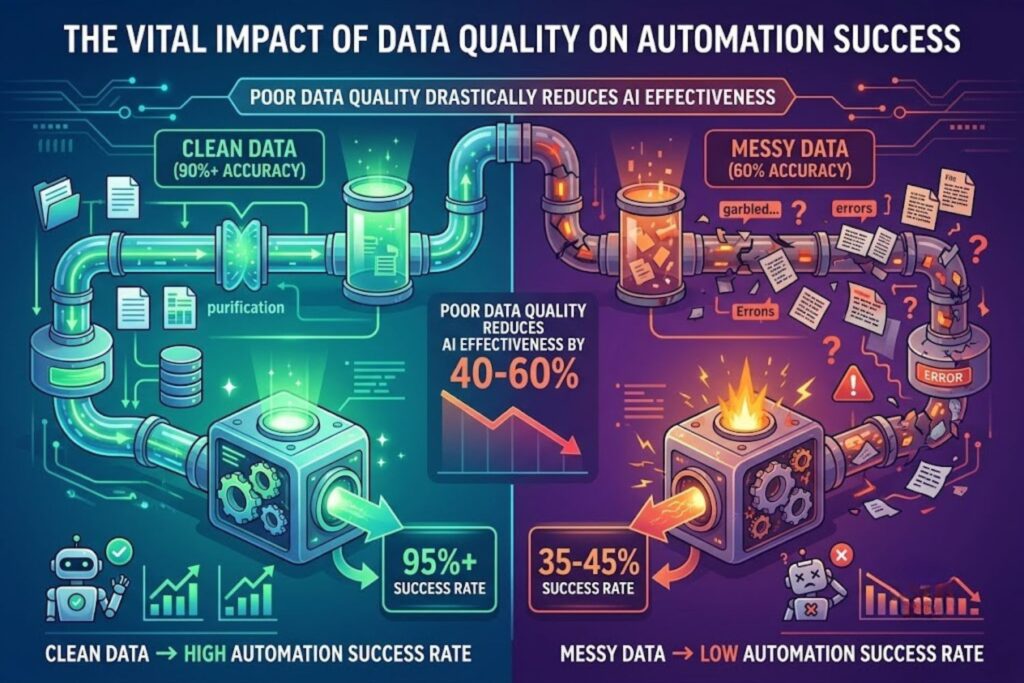
Here’s the brutal truth: garbage in, garbage out applies to automation more than anything else.
If your CRM has 30% duplicate contacts, your sales pipeline automation will misroute leads. If your invoice system has inconsistent line item formatting, your accounting automation will fail 15% of the time. If your customer data is scattered across 7 different systems with different formatting, your customer service automation becomes a nightmare.
Atlantic (in manufacturing context) found that poor data quality reduces AI effectiveness by 40-60%.
What to do:
- Invest in data quality audit before automation (not after)
- Create data governance standards
- Run data cleanup as a prerequisite, not parallel work
- Test automation against intentionally messy data to measure failure rate
- Plan for ongoing data quality maintenance
- Build automation that can identify bad data and escalate it
Integration Complexity & Legacy System Friction
Your automation tool needs to talk to 5 different systems. One system has modern APIs. One system from 2001 requires screen scraping. One system can only export CSV files once per day. One system uses legacy SOAP protocols.
Integration complexity is the #1 reason automation projects run over timeline.
What most teams underestimate:
- Time to get API credentials and access
- Unexpected authentication requirements
- Rate limiting on API calls
- Data format inconsistencies between systems
- Scheduled maintenance windows that break automations
- Permission restrictions that prevent the integration
- The 6-8 week wait to get IT approval on new integrations
What to do:
- Audit integration requirements in Phase 1 (before tool selection)
- Get IT/security approval for integrations early
- Plan for system maintenance windows
- Build fallback or manual escalation for integration failures
- Test integrations with real data before going to production
- Budget 20-30% additional timeline for integration friction
The Change Management Problem
Technology isn’t the hard part. People are.
71% of AI tools fail within 6 months because teams use them incorrectly or abandon them. That’s not a technology failure—that’s a people failure.
What causes adoption failure:
- Teams not understanding why they need to change
- Lack of training or unclear instructions
- The automation creates extra work (workflows designed incorrectly)
- No executive reinforcement that this matters
- Reversion to old methods when the system has issues
- Team members fearing job loss due to automation
What to do:
- Build a communication plan before launch (why this matters, what’s changing)
- Provide training that matches learning styles (video + written + hands-on)
- Create quick-win momentum (show results early)
- Address job concerns directly (reposition work, don’t eliminate roles)
- Get visible leadership support (manager endorsement matters)
- Create feedback channels (users can request improvements)
- Track adoption metrics (are people actually using this?)
Research from Martins (2023) found that visible leadership support and clear communication significantly increase adoption rates. Organizations that invest in change management see 3x higher adoption rates than those that don’t.
Skills Gap: Who Actually Builds This?
Most organizations lack in-house expertise to build and maintain automation. This creates a staffing challenge:
Option 1: Hire expertise — Expensive, time-consuming, difficult to retain
Option 2: Build with external partners — Expensive upfront, knowledge transfer challenges, ongoing support costs
Option 3: Train existing team — Requires time, assumes aptitude, keeps knowledge internal
Option 4: Hybrid approach — Partners help with design, internal team builds/maintains
Most successful organizations use a hybrid approach: external experts design the system and train internal staff, then internal staff builds and maintains it going forward.
What to do:
- Identify which team member has technical aptitude and bandwidth
- Invest in training (online courses, certifications, vendor training)
- Bring in external expertise for complex workflows
- Build documentation as you go (not after)
- Plan for knowledge retention (cross-train 2 people, not 1)
- Budget for ongoing learning (tools and platforms evolve)
The Workflow Redesign Requirement
Here’s what most teams don’t realize: automating your current workflow usually doesn’t work well.
Your current workflow evolved with human judgment in mind. It has workarounds for broken systems, shortcuts that make sense to humans, and exceptions that worked because humans are flexible.
Automation is brittle. It needs clean, predictable workflows.
The best implementations redesign the workflow first, then automate it. This takes additional time but creates dramatically better results.
Example: Your current customer support process: team member receives email → reads full email and history → searches CRM for context → reviews recent interactions → checks product docs → drafts response → sends → updates ticket status.
Automated version should be: email arrives → system extracts key info → queries CRM for customer history → retrieves relevant product docs → generates response → auto-sends → updates status → human reviews if confidence <95%.
The automated version is different from the manual version. That’s intentional.
How to Measure Automation ROI: The Framework
You can’t improve what you don’t measure. You can’t prove ROI if you don’t measure it. You can’t get budget for expansion if you can’t prove ROI.
This section provides a measurement framework most organizations skip—and then wonder why they can’t justify ongoing automation investments.
Establish Baseline Metrics Before Deployment
Non-negotiable: Measure for 2-4 weeks before deploying automation. This is the before state.
Monthly automation reporting (after launch):
- Compare before metrics to after metrics
- Calculate savings in dollars
- Identify unexpected issues (slower than expected, etc.)
- Show trend line (is it improving over time?)
- Identify optimization opportunities
KPI Taxonomy: Financial, Operational & Strategic Metrics
Financial KPIs:
- Cost per transaction (before vs. after)
- Annual cost savings
- Time savings converted to dollar value
- Implementation cost vs. annual savings (payback period)
- ROI percentage
Operational KPIs:
- Processing time per transaction (hours or minutes)
- Error rate and rework costs
- Cycle time from request to completion
- Throughput (number of transactions per week)
- Exception rate (manual escalations)
- System uptime and reliability
Strategic KPIs:
- Customer response time
- Customer satisfaction scores
- Employee satisfaction and attrition
- Compliance violations or audit findings
- Scalability without proportional cost increase
Adoption KPIs:
- Tool utilization rate (% of team using it)
- Workflow success rate
- Feature adoption (are teams using all features?)
- User feedback and satisfaction
Risk KPIs:
- Data accuracy and integrity
- Security incidents
- Compliance violations
- System availability
The 6-Dimension Measurement Framework
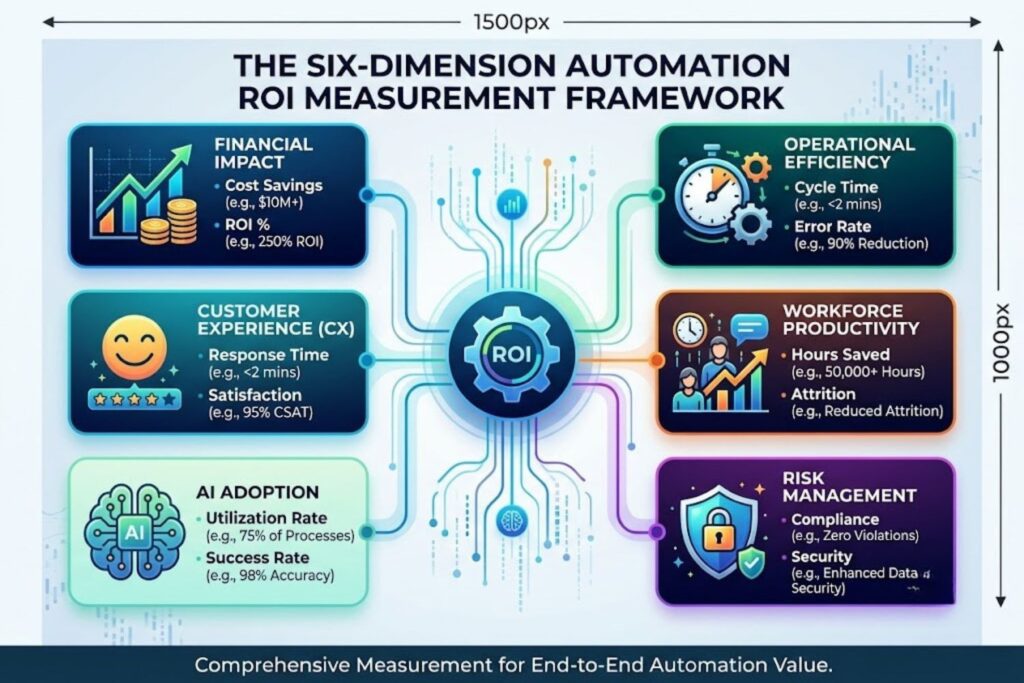
Track these six dimensions to understand total automation impact:
1. Financial Impact
- Cost savings: $(before) – $(after)
- ROI calculation: (Savings – Investment) / Investment × 100%
- Payback period: Investment / Annual Savings
- Target: 12-18 month payback period
2. Operational Efficiency
- Cycle time reduction: %(before time – after time) / before time
- Error reduction: %(before errors – after errors) / before errors
- Throughput increase: %(after volume – before volume) / before volume
- Target: 40-60% cycle time reduction, 70%+ error reduction
3. Customer Experience
- Response time: before vs. after (measured in hours)
- Customer satisfaction: NPS score or CSAT before vs. after
- First-response resolution rate
- Target: 50%+ response time reduction
4. Workforce Productivity
- Hours saved per week (converted to FTE capacity freed)
- Employee satisfaction: internal survey
- Attrition rate: before vs. after
- Time spent on high-value work
- Target: 30%+ hours saved, improved satisfaction scores
5. AI Adoption Rate
- % of team using automation tool
- Workflow success rate
- Manual escalation rate
- User satisfaction with tool
- Target: 90%+ adoption within 60 days of launch
6. Risk Management
- Compliance violations: before vs. after
- Data security incidents
- System uptime
- Audit findings
- Target: 100% compliance, zero security incidents
Avoiding Cost Tunnel Vision
The biggest measurement mistake: focusing only on short-term cost savings and ignoring bigger financial outcomes.
The best automation ROI comes from:
- Better forecasting (improved decisions through data)
- Innovation (freed-up time for new initiatives)
- Customer satisfaction (loyal customers increase lifetime value)
- Agility (ability to respond to market changes faster)
These take 6-12 months to fully realize, but they often exceed the immediate cost savings.
Example: Automating lead qualification saves $50,000 annually in employee time. But it also improves lead quality by 20%, which improves conversion rate by 8%, which generates an additional $200,000 in annual revenue. The second number dwarfs the first—but only if you measure beyond just cost savings.
How to Choose the Right Automation Tools
Hundreds of automation tools exist. Most organizations waste time evaluating tools before understanding their own requirements.
Here’s the right sequence:
1. Map your workflow first (know what you’re automating) 2. Assess your technical capabilities (what can your team handle?) 3. Define your requirements (what must the tool do?) 4. Evaluate against requirements (match tool to need, not need to available tool)
Most organizations reverse steps 1 and 4, then wonder why they chose the wrong tool.
Capability Matching Framework
Match tools to workflows, not workflows to tools.
Workflow Automation Platforms (n8n, Make, Zapier AI)
- Best for: 50-1,000 business automations, non-technical teams, visual workflows
- Strengths: Fast setup, easy to learn, extensive app integrations
- Limitations: Limited for complex logic, screen scraping, highly custom requirements
- Cost: $50-$500/month
- Time to value: 1-4 weeks
Robotic Process Automation (RPA) (Blue Prism, UiPath, Automation Anywhere)
- Best for: Legacy system automation, screen scraping, highly regulated industries
- Strengths: Handles complex UI automation, strong governance, enterprise support
- Limitations: Higher cost, requires more technical expertise, longer implementation
- Cost: $10,000-$100,000+ annually
- Time to value: 8-16 weeks
Custom LLM Agents (LangChain, n8n with AI models, Make with AI)
- Best for: Decision-making, unstructured data, dynamic workflows, chatbots
- Strengths: Intelligent, adaptive, handles ambiguity better than rule-based systems
- Limitations: Requires ML expertise, less predictable, higher failure rate
- Cost: $5,000-$50,000+ depending on complexity
- Time to value: 4-12 weeks
Cost-Benefit Comparison by Tool Type
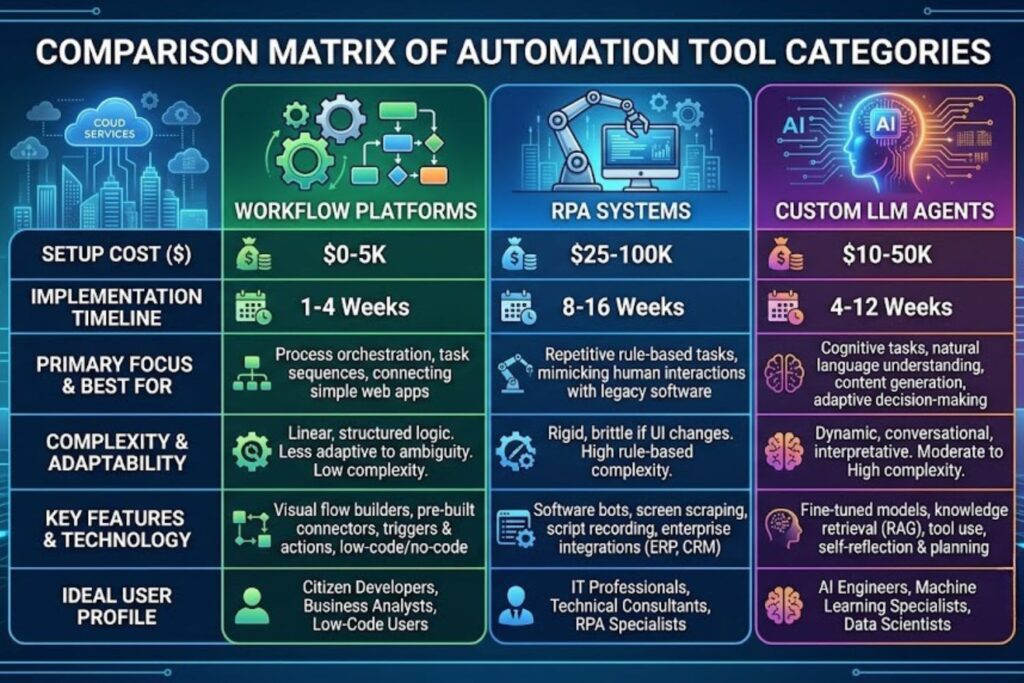
| Dimension | Workflow Platform | RPA | Custom LLM |
|---|---|---|---|
| Setup cost | $0-$5,000 | $25,000-$100,000 | $10,000-$50,000 |
| Monthly cost | $50-$500 | $2,000-$8,000 | $500-$5,000 |
| Time to deploy | 1-4 weeks | 8-16 weeks | 4-12 weeks |
| Complexity | Low | High | Medium |
| Learning curve | Shallow | Steep | Medium |
| Scalability | 500+ automations | 10-50 automations | 20-100 automations |
| Maintenance | Low | High | Medium |
| Best use case | Volume + simplicity | Legacy systems | Thinking tasks |
Integration Assessment Checklist
Before selecting a tool, verify it integrates with your systems:
□ Does it have native integration for your primary systems? (CRM, ERP, etc.) □ Can it authenticate via OAuth, API key, or database connection? □ Are there rate limits that would affect your use case? □ Does your IT security team approve the integration? □ Can it handle your data volume without issues? □ Are there scheduled maintenance windows that could affect you? □ Is there a fallback or manual escalation if integration breaks? □ How responsive is vendor support if integration fails?
Vendor Selection Criteria (Ranked by Impact)
#1: Does it integrate with your core systems? (Deal-breaker) If it can’t integrate with your CRM, ERP, or accounting system, it won’t work for you.
#2: Can your team use it? (Capability match) Does your team have technical skills? Workflow platforms. Complex requirements? RPA. Decision-making? AI agents.
#3: What’s the TCO? (Affordability) Total cost of ownership includes setup, monthly fees, training, support, maintenance. Don’t just look at monthly cost.
#4: Who provides support? (Reliability) Does the vendor provide support, or does it fall to your IT department? SaaS tools usually have better support.
#5: What’s the exit strategy? (Risk mitigation) Can you export your workflows and data if you need to switch tools? Are you vendor-locked?
Real-World Implementation: What Actually Works
Theory is useful. Seeing what actually works in practice is better.
These are real patterns from successful implementations (anonymized but accurate):
Case Study Pattern 1: Customer Support Automation (Quick Win)
Company: Mid-size SaaS company (50 employees) Process: Customer support ticket classification and triage Baseline metrics:
- 200 tickets per week
- 2.5 hours per ticket average handling time
- 15% first-response accuracy (tickets went to wrong team)
- 8-hour average first response time
Automation implemented:
- Sentiment analysis on incoming ticket (classify urgency)
- Category matching (which team should handle this?)
- Template-based response drafting
- CRM auto-update with ticket data
- Human review for low-confidence classifications
Results (after 8 weeks):
- 45-minute average response time (from 8 hours)
- 92% first-routing accuracy (from 15%)
- 1.5 hours total handling time (from 2.5 hours)
- Annual savings: ~$95,000 (2 FTE capacity freed)
- Implementation cost: $8,000
Timeline: 10 weeks from discovery to production Key success factor: Started simple (classification only), added response drafting after proving classification worked Failure mode avoided: Didn’t try to handle escalations automatically; built human escalation path
Case Study Pattern 2: Lead Qualification Workflows (Medium Complexity)
Company: Sales-focused business (100 employees) Process: Lead qualification and lead scoring Baseline metrics:
- 500 leads per week (various sources)
- 4 hours per lead to qualify manually
- 30% qualification accuracy (wrong leads got marked as qualified)
- 3-day average time from lead to qualification
Automation implemented:
- Multi-source lead ingestion (web forms, API feeds, email)
- Enrichment with company data and technographics
- Scoring algorithm based on 12 firmographic factors
- Routing to correct sales rep based on territory and workload
- CRM auto-update with lead data
- Slack notification for high-score leads
Results (after 12 weeks):
- 15-minute average lead delivery (from 3 days)
- 87% qualification accuracy (from 30%)
- Lead to first touch: 3 hours (from 3 days)
- 24% improvement in sales conversion rate
- Annual savings: ~$180,000 (3.5 FTE capacity freed)
- Additional revenue: ~$200,000 (from better qualification)
- Implementation cost: $25,000
Timeline: 14 weeks from discovery to production Key success factor: Redesigned the qualification criteria before automation (wasn’t just automating the old process) Failure mode avoided: Built validation workflow where reps could flag misqualified leads, improving the AI over time
Case Study Pattern 3: Enterprise Data Pipeline Automation (High Complexity)
Company: Enterprise software company (500 employees) Process: Multi-system data synchronization and reporting Baseline metrics:
- 2 million daily data points across 7 systems
- 80 hours per week manual data reconciliation
- 15% data discrepancies between systems
- 2-day lag for reporting availability
Automation implemented:
- Real-time data sync from 7 systems via APIs
- Data quality validation and anomaly detection
- Automated reconciliation for 85% of records
- Human escalation for mismatches
- Real-time dashboards (vs. 2-day delay)
- Automated data quality reporting
Results (after 16 weeks):
- 4-hour data latency (from 2 days)
- 99.2% data accuracy (from 85%)
- 70 hours per week capacity freed
- $280,000 annual savings
- Improved decision-making through real-time data
- Implementation cost: $65,000
Timeline: 18 weeks from discovery to production Key success factor: Invested heavily in data quality audit before automation; fixed data issues first Failure mode avoided: Didn’t try to automate all 7 systems simultaneously; started with most critical 3, expanded later
Common pattern across all three:
- Started with simpler workflows, built confidence, then expanded
- Included human escalation paths
- Measured baseline before deployment
- Invested in change management and training
- Focused on high-volume, predictable processes
- Avoided trying to automate everything at once
Common Failure Modes & Prevention Strategies
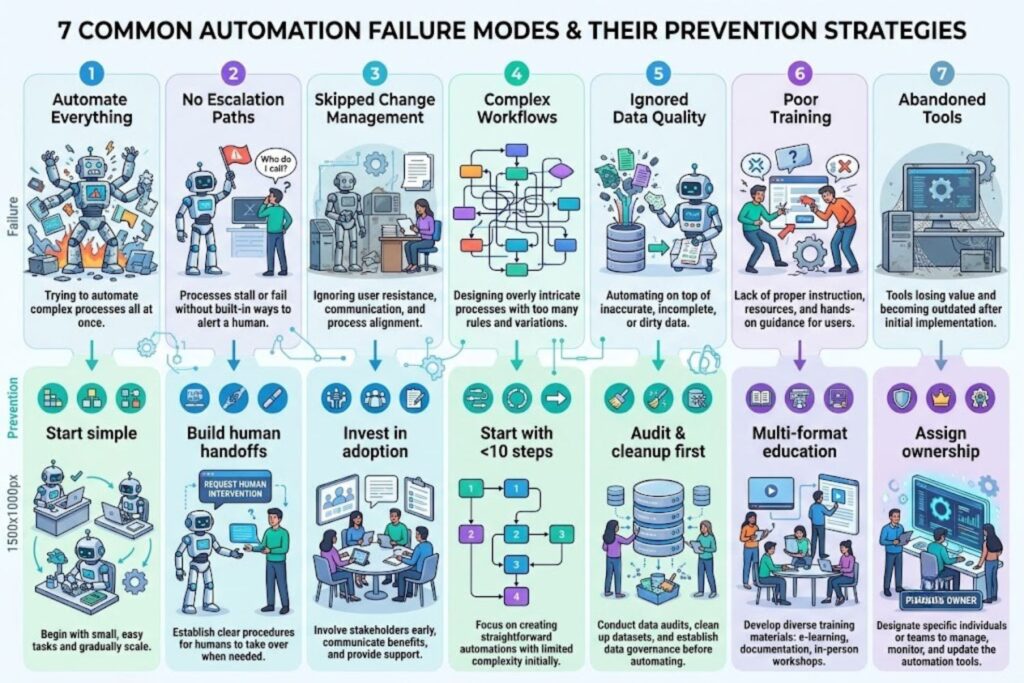
These aren’t theoretical failures. They happen repeatedly.
The “Automate Everything at Once” Trap
What happens: Team gets excited about automation and tries to automate 10 processes simultaneously.
Why it fails:
- Overwhelms resources
- Creates too many change management challenges
- Makes it impossible to isolate what’s working
- Leads to scaling failures (systems built for 100 transactions break at 1000)
- Amplifies the impact of a single failure across multiple processes
Prevention: Automate one high-impact process, validate it, expand to one additional process, then scale.
Automation Without Human Escalation Paths
What happens: Team builds automation that has no way to hand off to humans when it fails.
Why it fails:
- When exceptions occur (and they will), the system gets stuck
- Customers don’t get responses
- Errors cascade
- Manual workarounds become the actual workflow
- Team loses trust in automation
Prevention: Every automation workflow must have a defined escalation point. If the system can’t handle something with 95%+ confidence, it escalates to a human instead of guessing.
Skipping the Change Management Phase
What happens: Team builds amazing automation, launches it, and watches adoption rate hover around 30%.
Why it fails:
- People don’t understand why they need to change
- No one trained them
- They revert to old methods when the system has issues
- The tool gets branded as “something IT forced on us”
- 71% failure rate (per Kore.ai) occurs here
Prevention: Invest 20% of project effort on change management (communication, training, executive sponsorship, feedback channels)
Building Complex Workflows Before Testing Simple Ones
What happens: Team tries to automate a 50-step workflow on their first attempt.
Why it fails:
- Too many variables to test
- Failures are hard to isolate
- ROI takes too long to prove
- Team loses confidence before seeing results
Prevention: Start with workflows under 10 steps. Get success, then expand.
Ignoring Data Quality Before Deployment
What happens: Team deploys automation against messy, inconsistent data.
Why it fails:
- Automation failure rate exceeds 25%
- Garbage in, garbage out (automation magnifies data problems)
- Manual workarounds consume any time saved
- Projects get marked as failures
Prevention: Audit data quality in Phase 1. Run data cleanup as prerequisite work. Test automation against intentionally messy data.
Abandoning Tools Due to Poor Training
What happens: Team gets minimal training, deployment happens, and they revert to old methods.
Why it fails:
- People don’t know how to use the tool effectively
- Small problems become deal-breakers (people think the tool is broken, it’s actually user error)
- Adoption rate crashes
Prevention: Provide training in multiple formats (video, hands-on, written). Create quick reference guides. Offer ongoing support.
Tools Orphaned After Initial Deployment
What happens: After launch, nobody owns the automation. It runs unmaintained for 6 months until something breaks.
Why it fails:
- When the tool needs adjustment, nobody updates it
- When integrations break, nobody fixes them
- When new requirements emerge, the tool becomes obsolete
- Eventually it gets abandoned
Prevention: Assign ongoing ownership. Allocate 2-4 hours per week for monitoring and optimization. Plan for evolution as business needs change.
Droven IO AI Automation Tools vs. Alternatives
“Should we use Droven.io?” is actually the wrong question if you haven’t understood what Droven.io is.
The real comparison is among tool categories, not specific products.
Workflow Automation Platforms (n8n, Make, Zapier AI)
What they are: Visual workflow builders with extensive pre-built integrations
Best for:
- Non-technical teams
- Quick ROI needs (launch in weeks, not months)
- 50-1,000 automations per organization
- Integration-heavy workflows
Strengths:
- Huge marketplace of integrations (500+ apps)
- Visual builder (no code required)
- Fast setup
- Large community and support
Weaknesses:
- Limited for complex logic
- Can’t handle legacy systems (screen scraping is limited)
- Scalability limitations at very high volume
- Vendor lock-in (hard to export workflows)
Cost structure: $50-$500/month SaaS fee Time to value: 1-4 weeks Who uses: Marketing teams, operations, sales operations, customer service
Robotic Process Automation (RPA) Platforms
What they are: Systems that automate by mimicking human keyboard/mouse interaction with systems
Best for:
- Legacy system automation
- Complex business processes
- Highly regulated industries
- Screen scraping from older systems
Strengths:
- Works with any system (mimics human interaction)
- Strong governance and audit trails
- Enterprise support
- Can handle very complex logic
Weaknesses:
- Expensive setup and licensing
- Requires technical expertise
- Long implementation timelines
- Brittle (system updates break automations)
Cost structure: $25,000-$100,000+ annually Time to value: 8-16 weeks Who uses: Financial services, insurance, large enterprises
Custom LLM Agents & In-House Development
What they are: AI-native systems using large language models for reasoning and decision-making
Best for:
- Decision-making automation
- Unstructured data processing
- Chatbots and conversational interfaces
- Dynamic, unpredictable workflows
Strengths:
- Highly intelligent and adaptive
- Can handle ambiguity
- Learns from interactions
- Future-proofed (uses cutting-edge AI)
Weaknesses:
- Requires machine learning expertise
- Higher failure rate (LLMs can hallucinate)
- Less predictable than rule-based systems
- Ongoing monitoring required
Cost structure: $5,000-$50,000+ depending on complexity, plus ongoing operational costs Time to value: 4-12 weeks Who uses: Tech-forward companies, enterprises with AI capability
Comparison Matrix: Capabilities, Costs, Time to Value
| Dimension | Workflow Platform | RPA | Custom LLM |
|---|---|---|---|
| Setup complexity | Low | Very high | High |
| Technical skill required | Minimal | High | Very high |
| Scalability | 500+ automations | 10-50 automations | 20-100 automations |
| Cost to launch | $0-$5,000 | $25,000-$100,000 | $10,000-$50,000 |
| Monthly operational | $50-$500 | $2,000-$8,000 | $500-$5,000 |
| Time to production | 1-4 weeks | 8-16 weeks | 4-12 weeks |
| Integration coverage | 500+ apps | Any via UI | APIs + custom code |
| Best for volume | Low to medium | Medium | Low to medium |
| Failure rate | 5-10% | 5-8% | 10-20% |
| ROI payback period | 6-9 months | 12-18 months | 9-15 months |
Quick Start Checklist for Organizations New to Automation
Pre-Deployment: 10-Item Readiness Checklist
□ Leadership agrees this automation is a priority (budget + time approved) □ We’ve documented the current workflow step-by-step □ We’ve measured baseline metrics (processing time, error rate, hours spent) □ We’ve identified which systems need to integrate □ We’ve secured access to APIs and credentials for integrations □ We’ve assessed data quality and identified cleanup needs □ We’ve allocated a team member (10-20 hours/week) to own this □ We’ve identified escalation criteria (when does a human take over?) □ We’ve created a communication plan (why this matters to the team) □ We’ve defined success metrics (what does success look like?)
Score: 8-10 = Ready to proceed. 6-7 = Address gaps first. <6 = More prep needed.
Deployment: 8-Step Implementation Checklist
□ Phase 1 complete: Discovery and baseline measurements captured □ Phase 2 complete: Workflow redesigned (not just automated) □ Phase 3 complete: Pilot tested with 95%+ success rate □ Integration testing complete (all systems connect reliably) □ Escalation paths documented and tested □ Team trained and comfortable with new workflow □ Data quality issues resolved (tested with intentionally messy data) □ Go-live plan created with support protocols
Post-Launch: Ongoing Success Checklist (Monthly)
□ Success rate metric tracking (should maintain 95%+) □ ROI metrics compared to baseline (are we achieving projected savings?) □ Adoption metrics reviewed (are teams using the automation?) □ Escalation analysis complete (are exceptions handled appropriately?) □ System uptime and reliability metrics captured □ User feedback gathered and addressed □ Optimization opportunities identified □ Performance trends analyzed (improving, plateauing, declining?)
FAQ Section: 15 Highly Relevant Questions
1. What’s the typical ROI timeline for automation projects?
Most organizations see positive ROI within 12-18 months. Workflow automation platforms may show ROI faster (6-9 months), while RPA typically takes longer (15-24 months) due to higher setup costs. However, this assumes proper measurement—many organizations never prove ROI because they skip baseline measurements.
2. Why do 71% of AI automation projects fail?
Kore.ai research shows that 71% of AI tools get abandoned within six months. The reason? It’s rarely the technology. It’s usually: people didn’t adopt it (lack of change management), ROI wasn’t measured (so nobody knew if it worked), workflows weren’t redesigned (automation of broken processes fails), escalation paths didn’t exist (system got stuck when edge cases occurred), or training was insufficient (team didn’t know how to use it).
3. What’s the biggest mistake organizations make with automation?
The single biggest mistake is automating broken processes instead of fixing them first. The second biggest mistake is skipping change management and then wondering why adoption is 30%. The third is measuring only cost savings while missing strategic and experiential ROI.
4. How much does automation cost?
Cost depends entirely on tool category. Workflow platforms: $50-$500/month SaaS fee + $0-$5,000 setup. RPA: $25,000-$100,000+ annually + $25,000-$100,000 setup. Custom LLM agents: $10,000-$50,000 initial development + $500-$5,000 monthly. Most organizations underestimate by 30-40% because they don’t account for training, change management, and hidden integration complexity.
5. How long does automation implementation take?
Workflow platforms: 1-4 weeks from discovery to production. RPA: 8-16 weeks. Custom agents: 4-12 weeks. Most teams underestimate by 4-8 weeks because they don’t account for: integration friction (6-8 weeks is common), data quality issues (4-6 weeks to fix), workflow redesign time (2-4 weeks), or change management delays (2-4 weeks).
6. What’s “productivity leakage” and how do we avoid it?
Productivity leakage happens when you automate work that saves 5 hours per week, but the person who did the work now sits idle. You haven’t created ROI—you’ve just shuffled the cost structure. Avoid this by planning how freed-up time creates new value: customer-facing work, strategic initiatives, skill development, or revenue-generating activities. Without this redirection, time savings never convert to business value.
7. Should we automate our processes as they currently exist?
No. This is the #1 implementation mistake. Current processes evolved with human judgment in mind. They include workarounds, shortcuts, and exceptions that make sense to humans but break automation. High-performing organizations redesign workflows first (accounting for automation capabilities), then automate the improved process. McKinsey research shows this captures 3x more ROI than automating existing processes.
8. What data quality issues kill automation projects?
Poor data quality reduces AI effectiveness by 40-60%. Common issues: duplicate records (CRM has 30% duplicates), inconsistent formatting (invoices formatted different ways), missing values (required fields sometimes empty), scattered data (information across 7 different systems), outdated information (data rarely refreshed), or unmapped values (code “A” means different things in different systems). Solution: audit data quality before automation, run cleanup as prerequisite work, not parallel work.
9. How do we measure automation ROI?
Establish baseline measurements before deploying (measure for 2-4 weeks). Measure these metrics: processing time, error rate, hours spent, manual effort, customer response time, employee satisfaction, compliance violations. Then deploy automation and measure the same metrics again after 4-12 weeks. The comparison is your ROI proof. Most organizations fail at this step because they skip baseline measurement.
10. What’s the difference between Droven.io and automation tools like n8n or Make?
Droven.io is a knowledge/research platform that explains what automation tools do, who they serve, and where they fail. It’s not software—it doesn’t actually run automations. n8n and Make are execution platforms—they actually build and run workflows. Use Droven.io to research and understand the landscape. Use n8n/Make (or RPA tools, or custom agents) to implement actual automations.
11. How do we prevent automation from replacing jobs and causing team resistance?
Address job concerns directly and early. The narrative should never be “this automation will replace you.” The narrative should be “this automation handles repetitive work so you can focus on meaningful work.” Reposition freed-up time toward high-value activities: customer relationships, strategic projects, skill development. Visible leadership support matters—managers need to reinforce that automation supports career growth, not elimination.
12. What’s the most common reason automation projects get abandoned post-launch?
Lack of ongoing ownership. After launch, nobody “owns” the automation. When it needs adjustment (requirements change), nobody updates it. When integrations break (system updates happen), nobody fixes them. After 6 months of degradation, the tool gets abandoned. Solution: assign clear ownership, allocate 2-4 hours per week for ongoing management, plan for evolution as business needs change.
13. Should we start with simple workflows or complex ones?
Start simple. Automating a 50-step workflow on your first attempt creates too many variables and makes failures hard to isolate. Start with workflows under 10 steps, prove success, build team confidence, then expand. This approach also demonstrates ROI faster, securing budget for expansion.
14. How do we handle exceptions and errors in automated workflows?
Build defined escalation paths. If your automation can’t handle something with 95%+ confidence, it should escalate to a human instead of guessing. Document: what triggers escalation, who handles it, what information they need, and how quickly they should respond. This prevents automation from getting stuck when edge cases occur.
15. What’s the biggest opportunity organizations miss with automation?
Most organizations focus only on cost savings (operational ROI) and miss strategic and experiential ROI. The best automation delivers: faster customer response, better decision-making through better data, improved employee satisfaction, business agility, and competitive advantage. These take longer to realize (6-12 months) but often exceed immediate cost savings by 3-5x. Organizations that measure only cost savings miss the bigger financial picture.